Learn which B2B customer experience metrics matter most for China sourcing and dropshipping. This guide covers CSAT, NPS, quote conversion, supplier quality, delivery exceptions, and repeat purchases, with practical formulas and a scorecard sellers can use to spot friction.
B2B customer experience metrics help sellers answer a question that revenue alone cannot: How easy and dependable is it to source, pay for, and deliver products through your platform? For a business sourcing from China, a low product price means little if the final landed cost is unclear, a shipment cannot be tracked, or a quality issue takes weeks to resolve.
That makes measurement especially important for a sourcing and dropshipping platform such as Looperbuy. Its customers may be trying to reduce inventory, warehousing, payment, and logistics-management burdens. To understand whether the experience actually supports those goals, the platform must measure the complete journey—not just website visits or survey scores.
McKinsey’s 2024 B2B Pulse research found that buyers used an average of ten interaction channels during their purchasing journey. More than half of respondents wanted a seamless experience as they moved between channels. For a sourcing platform, information shared through a product page, quotation, support conversation, and order dashboard must therefore remain consistent.
Table of Contents
What Should a B2B Sourcing Platform Measure?
The most useful B2B customer experience KPIs connect three types of evidence:
– Buyer perception: Was the quotation understandable? Was the issue easy to resolve?
– Operational delivery: Was the product checked, dispatched, and delivered as promised?
– Commercial behavior: Did the customer place another order or stop buying?
A sourcing platform also needs measures for supplier verification, landed-cost transparency, quality exceptions, tracking, and claims, because these events can determine whether a seller feels confident accepting its next customer order.
A useful rule is to attach every metric to a specific decision. “Improve satisfaction” is too vague. “Investigate suppliers with repeated inspection failures before approving new listings” tells a team what to do.
Map the Journey Before Building a Dashboard
Follow one buyer from product discovery to repeat purchase. Record where the buyer needs information, who provides it, and what can go wrong.
| Journey stage | Buyer’s practical question | Useful measurement |
| Product discovery | Can I identify a suitable product and supplier? | Product-information completeness |
| Quotation | What will the order cost, and what is included? | Quote turnaround and quote-to-order rate |
| Order approval | Can I pay and submit the order without confusion? | Checkout completion and payment exceptions |
| Sourcing and preparation | Is the item available and consistent with its description? | Supplier verification and inspection pass rate |
| Fulfillment | Was the parcel dispatched when promised? | On-time dispatch rate |
| Delivery and after-sales | Can I track it and resolve problems? | Tracking latency, delivery exceptions, resolution time |
| Repeat purchase | Is this process reliable enough to use again? | Reorder rate and cohort retention |
Measure Satisfaction Without Losing Context
Survey metrics are valuable, but each answers a different question. CSAT measures satisfaction with a defined interaction. NPS captures a broader willingness to recommend. A customer-effort question helps reveal how hard the buyer worked to complete a task. Qualtrics advises using these measures together rather than treating one as a substitute for another.
Customer Satisfaction Score (CSAT)
Ask a short question after a meaningful event: “How satisfied were you with the clarity of your quotation?” or “How satisfied were you with the resolution of this delivery issue?”
For a five-point survey, calculate:
CSAT=Responses rated 4 or 5÷All valid responses×100
If 80 of 100 valid responses are rated 4 or 5, CSAT is 80%. Always label the touchpoint. A quotation CSAT score and a claims-resolution CSAT score describe different experiences and should not be combined without context.
Customer Effort Score (CES)
Ask whether it was easy to complete one task, such as understanding a landed-cost estimate or finding shipment status. The wording and scale matter: some surveys ask about *ease*, while others ask about *effort*. Choose one approach and keep it consistent. Review written comments alongside the score so a team can identify the step that created friction.
Net Promoter Score (NPS)
Ask how likely an account contact is to recommend the platform on a 0–10 scale. Responses of 9–10 are promoters, 7–8 are passives, and 0–6 are detractors:
NPS=% promoters−% detractors
NPS ranges from −100 to +100; it is not a percentage. If 70% of respondents are promoters and 20% are detractors, NPS is 50. In B2B, ask who answered—a purchasing manager and a fulfillment operator may experience the same account very differently.
Practical safeguard: Send surveys at defined moments, record response rates, and examine comments from dissatisfied accounts. Do not assume that buyers who answer are representative of buyers who stay silent.
Track Service and Buying Friction
A seller may tolerate a complicated product search once. Repeating a complicated process for every order is another matter. Service and transaction metrics show where that effort accumulates.
First Response and Resolution Time
First response time is the elapsed time between a buyer’s request and the first meaningful reply. Separate automated acknowledgment from an answer that advances the issue. Report results by channel and issue type; a question about product dimensions is not equivalent to a missing shipment.
Resolution time is the elapsed time between opening an issue and resolving it. Report the median and 90th percentile, as well as the average. This makes long-running exceptions visible instead of allowing them to disappear inside one mean value.
First-Contact Resolution
First-contact resolution (FCR) measures the share of eligible issues resolved during the first substantive interaction:
FCR=Eligible issues resolved on first contact÷All eligible issues×100
Exclude matters that necessarily require later evidence, carrier investigation, or inspection. Otherwise, the score may reward premature ticket closure rather than a real solution. Review reopened cases alongside FCR.
Quote-to-Order and Checkout Completion
For sourcing platforms, quote-to-order rate can be more informative than general website conversion:
Quote-to-order rate=Quotes that become orders÷Valid quotes issued×100
Define a conversion window and compare similar requests. If a buyer receives several quote revisions, decide whether they count as one opportunity or multiple quotes before reporting the metric.
Measure checkout separately. Baymard Institute reports a 70.22% average cart-abandonment rate across 50 ecommerce studies, but that broad figure should not be presented as a B2B sourcing benchmark. B2B buyers may save a cart while awaiting internal approval or a final freight estimate.
For a defined group of carts, use:
Cart abandonment rate=(Carts created−Carts converted to orders)÷Carts created×100
A dashboard should also record *why* an order stopped: unexpected shipping cost, payment failure, unavailable inventory, missing documentation, or an approval delay. The reason determines the fix.
Add Metrics That Reflect Cross-Border Reality
Generic customer-experience dashboards often stop at purchase. For cross-border sourcing, the experience remains unfinished until the seller can account for product quality, shipping cost, and delivery.
DHL’s 2025 B2B ecommerce report identifies fast and flexible delivery, transparent tracking, straightforward returns, and simple checkout among business-buyer expectations. It also reports that 44% of surveyed B2B retailers not yet selling overseas cited expensive delivery as a barrier, while 32% wanted to avoid customs complexity. These are findings about the surveyed retailers—not performance benchmarks for Looperbuy.
Landed-Cost Clarity Rate
A quoted product price is only one part of a buying decision. Define a landed-cost clarity rate as the share of eligible quotes that disclose all cost components known at quotation time and clearly flag those still estimated or excluded.
Check for product cost, domestic handling where applicable, international shipping, platform or service fees, estimated duties and taxes where offered, and the assumptions behind the estimate. Avoid claiming a “final” landed cost when destination charges remain uncertain.
This is a proposed internal diagnostic, not an industry-standard formula. Its value lies in reducing surprise, not in producing an impressive percentage.
Supplier Verification and Quality Exceptions
Track the share of active suppliers with the verification steps your business requires. Then separately track orders that fail a documented pre-dispatch quality check:
Inspection exception rate=Inspected orders with a recorded exception÷Inspected orders×100
Record the exception type: wrong specification, visible defect, missing quantity, packaging damage, or labeling mismatch. An inspection is useful only if it applies criteria the buyer and supplier can understand. Do not imply that inspection eliminates every defect.
Dispatch, Tracking, and Delivery Exceptions
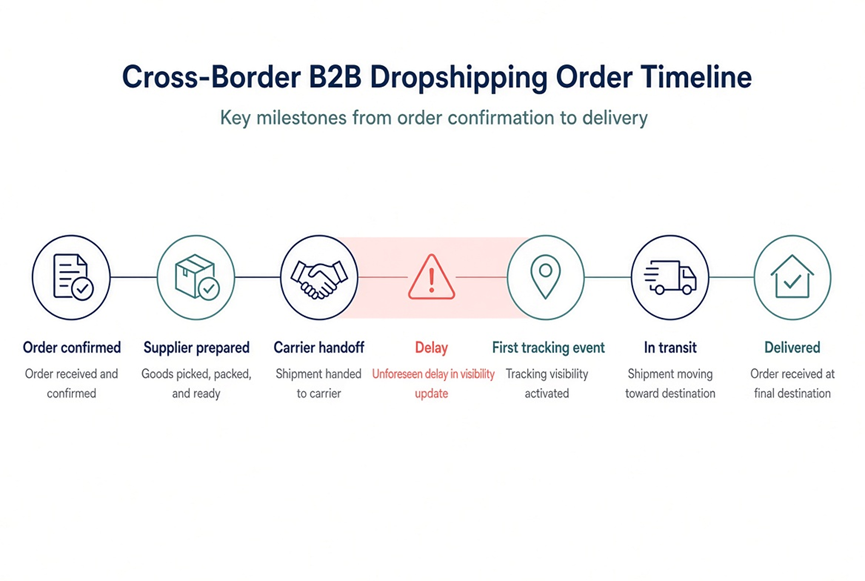
Measure whether an order leaves within the promised dispatch window, not an arbitrary universal target. Track how long it takes for a usable tracking event to appear after handoff. Keep carrier delays and pre-dispatch sourcing delays separate, because they call for different remedies.
For returns and claims, record the time from a buyer’s first report to an agreed resolution. Also track whether the remedy was a refund, replacement, credit, or documented rejection. A fast answer is not necessarily a fair outcome.
Connect Experience to Retention
A dashboard full of green service metrics is not enough if buyers quietly stop ordering. Reorder rate helps test whether a good first transaction leads to another:
Reorder rate=(Eligible first-time buying accounts that reorder within a defined window)÷(Eligible first-time buying accounts)×100
Choose a window that matches the product category’s purchase cycle. A monthly replenishment seller and a seasonal importer should not be judged against the same clock.
For churn, count accounts that met a previously defined “active” rule at the start of the period but became inactive under that same rule:
Customer churn rate=(Starting active accounts lost during the period)÷Active accounts at period start×100
Do not subtract ending accounts from starting accounts if new accounts joined during the period; that would hide losses. Qualtrics also notes that the point at which a buyer should be considered churned depends on the usual buying cycle.
Where order economics permit, review contribution margin by account alongside retention. A high-volume account can still be difficult to serve profitably if exceptions, reshipments, and support work are unusually frequent.
Turn a Dashboard Into Decisions
Consider an illustrative cohort of 100 new seller accounts. Sixty receive a quote, 30 place a first order, and 18 reorder within the chosen observation window. The 60% quote-request rate, 50% quote-to-order rate, and 60% first-to-second-order rate describe different stages; none explains the cause by itself.
If most drop-offs occur after quotations, review cost clarity, availability, and payment steps. If they occur after first delivery, compare quality exceptions, tracking delays, and claims with accounts that did reorder. Then speak to buyers before changing the process.
A practical operating rhythm is:
1. Define every metric: Specify the event, denominator, observation window, exclusions, and data owner.
2. Segment before reacting: Compare new and established accounts, destinations, product categories, suppliers, and fulfillment methods.
3. Investigate one failure mode: Pair platform events with support tickets and buyer interviews.
4. Assign a change: Name its owner, expected outcome, and review date.
5. Check the result: Look for improvement in both the immediate metric and a downstream measure such as reorder rate.
For example, if quotes convert poorly only on one shipping route, the right response may be a clearer freight estimate—not a redesign of every product page. This is an operational example, not a reported Looperbuy case study.
Where Should Looperbuy Begin?
Start with a small scorecard: quote-to-order rate, landed-cost clarity, inspection exception rate, on-time dispatch, issue-resolution time, and first-to-second-order rate. Add CSAT at quotation and issue resolution. These measures span the buyer’s decision, the platform’s delivery, and the likelihood of another order.
If you are evaluating a China sourcing or dropshipping partner, ask Looperbuy to walk through a sample product request. Request an itemized quote, the applicable supplier and quality-check steps, a sample order timeline, and the process for handling delivery exceptions. Judge the experience against your own product, destination, margin, and service requirements.
Frequently Asked Questions
1. What is the most important B2B customer experience metric?
There is no universal winner. For a sourcing platform, pair an operational measure—such as on-time dispatch or inspection exceptions—with a commercial outcome such as reorder rate. One shows what happened; the other helps show whether buyers trusted the process enough to return.
2. Should we measure CSAT, CES, or NPS?
Use each for its intended purpose. CSAT can assess a recent quotation or support case. A customer-effort question tests how easy a task felt. NPS reflects broader willingness to recommend. None replaces order and delivery data.
3. How often should B2B customer experience KPIs be reviewed?
Review time-sensitive exceptions as they occur. Examine operational trends at a consistent weekly or monthly interval, and assess reorder or churn cohorts only after their defined purchase window has elapsed. The reporting cadence should match the decision the team needs to make.
4. Does a high cart-abandonment rate always indicate poor checkout?
No. Some buyers are comparing options or waiting for approval. Separate those cases from preventable failures such as unclear charges or payment errors. Baymard explicitly notes that some cart abandonment reflects browsing rather than a fixable checkout problem.
5. How can a platform measure supplier quality fairly?
Document the inspection criteria first. Report the number of inspected orders, the exception rate, and exception types. Compare suppliers handling similar products, rather than ranking unlike categories by one raw percentage.
6. Can faster replies compensate for delivery problems?
Faster replies help buyers understand what is happening, but they do not replace an accurate quote, reliable dispatch, or an appropriate resolution. Measure response time alongside delivery exceptions and the final claim outcome.
References
1. Marina Conquest, “[Driving B2B Excellence: TOP-15 CX Metrics and Customer Service KPIs]”
2. Candace Lun Plotkin, Jennifer Stanley, Liz Harrison, and Víctor García de la Torre, “[Five Fundamental Truths: How B2B Winners Keep Growing]”
3. Qualtrics, “[CSAT vs NPS: Which Customer Satisfaction Metric Is Best?]”
4. Qualtrics, “[Customer Churn and How to Calculate Churn Rate]”
5. Baymard Institute, “[50 Cart Abandonment Rate Statistics 2026]”
6. DHL eCommerce, “[2025 B2B E-Commerce Trends Report]”