.jpeg)
If you’re running any form of digital advertising — whether you’re a publisher monetizing inventory or a B2B platform selling ad space — you’ve encountered the term eCPM. But knowing how to calculate eCPM and actually using it to make smarter revenue decisions are two very different things.
I’ve spent years analyzing ad performance data across B2B platforms, and I’ve seen too many teams treat eCPM as a vanity metric rather than a strategic tool. This guide changes that.
We’ll break down the formula, walk through real calculation examples, and show you how to apply eCPM insights to optimize everything from floor pricing to ad placement strategy. Whether you’re evaluating campaign efficiency or benchmarking against industry standards, this is the practical guide you need.
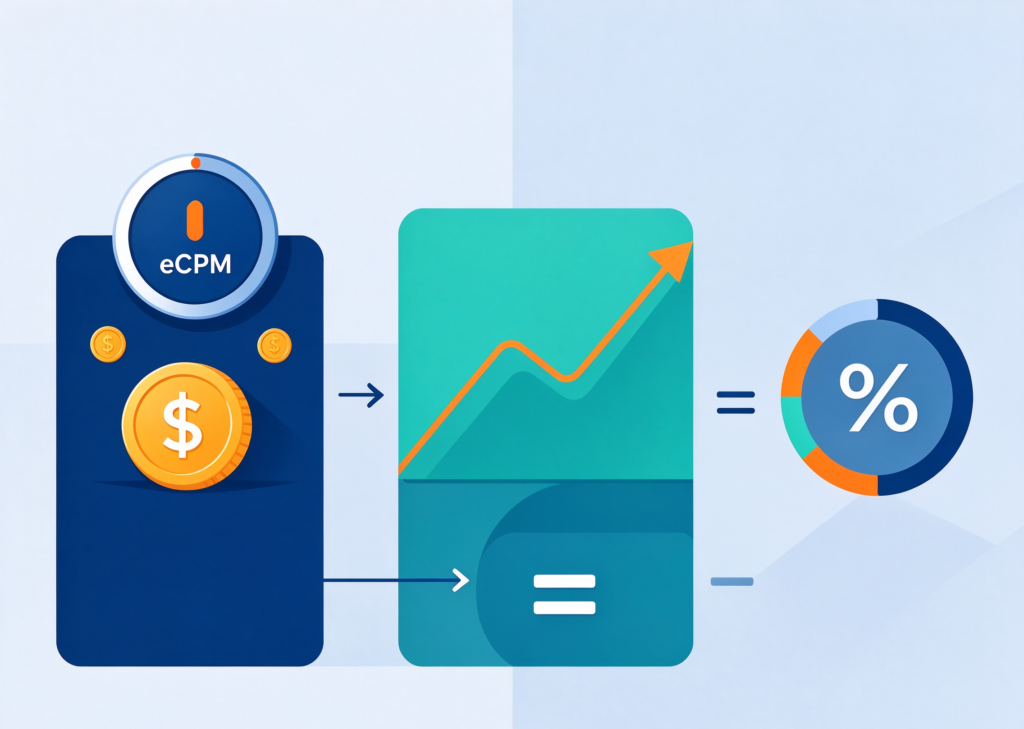
Suggested visual placement: A clean infographic showing the eCPM formula —
eCPM = (Total Revenue ÷ Total Impressions) × 1,000— with labeled inputs and outputs. Place this immediately below the introduction.
Table of Contents
What Is eCPM and Why Does It Matter?
eCPM stands for effective cost per mille (where “mille” means one thousand). It represents the estimated revenue you earn for every 1,000 ad impressions served, regardless of the pricing model used.
The word “effective” is the key. Not all ad deals are priced on a CPM basis. Some use CPC (cost per click), CPA (cost per acquisition), or other performance models. eCPM normalizes all of them into a single metric so you can compare apples to apples.
For B2B platforms — especially those facilitating cross-border sourcing and trade — this matters more than ever. When you’re selling ad inventory to brand manufacturers, wholesalers, or production companies, those advertisers are spending real money to reach procurement decision-makers. eCPM tells you whether those impressions are delivering value.
Why eCPM matters for B2B publishers and advertisers:
- Comparison across formats. Banner, native, interstitial, video — each has different pricing structures. eCPM flattens them into one view.
- Revenue forecasting. Once you know your average eCPM, you can estimate earnings from projected impression volumes.
- Partner evaluation. When working with multiple ad networks or demand partners, eCPM reveals which relationships actually generate value.
- Budget planning. Advertisers use eCPM to set realistic spending expectations before a campaign launches.
The eCPM Formula: How to Calculate It Step by Step
The standard formula is remarkably straightforward:
eCPM = (Total Revenue ÷ Total Impressions) × 1,000
That’s it. You take your total ad revenue, divide it by the number of impressions, and multiply by 1,000.
But here’s where most guides stop — and where the real work begins.
A Practical Calculation Example
Let’s say your B2B sourcing platform runs a display campaign for a global logistics partner. Over the past 30 days:
- Total ad revenue: $4,500
- Total impressions: 1,200,000
eCPM = ($4,500 ÷ 1,200,000) × 1,000 = $3.75
That means you’re earning $3.75 for every 1,000 impressions served.
Now, let’s say you’re also running a native ad unit for a manufacturer targeting procurement managers in Southeast Asia. That campaign generated $2,800 in revenue from 350,000 impressions.
eCPM = ($2,800 ÷ 350,000) × 1,000 = $8.00
The native unit delivers more than double the eCPM of the display banner. That’s actionable intelligence — you know where to invest more inventory.
Suggested visual placement: A side-by-side comparison chart showing the two campaigns above, with bars representing eCPM values. Alternatively, a simple table (shown below) could work if you prefer a text-based visual.
| Campaign Type | Total Revenue | Total Impressions | eCPM |
|---|---|---|---|
| Display Banner | $4,500 | 1,200,000 | $3.75 |
| Native Ad Unit | $2,800 | 350,000 | $8.00 |
What If You’re Running Mixed Pricing Models?
This is where eCPM becomes genuinely powerful. Suppose you run:
- A CPC campaign earning $0.80 per click with a 0.5% click-through rate
- A CPM campaign at a fixed $5.00 rate
The CPC campaign’s effective cost per impression is $0.80 × 0.005 = $0.004. Scaled to 1,000 impressions, that’s an eCPM of $4.00. The CPM campaign is already at $5.00 eCPM. Now you have a clean comparison: the CPM deal is outperforming the CPC arrangement on a revenue-per-impression basis.
eCPM vs CPM vs RPM: Clearing Up the Confusion
These three acronyms get mixed up constantly, and the confusion costs publishers real money. Here’s the definitive breakdown:
| Metric | Full Name | Perspective | What It Measures |
|---|---|---|---|
| CPM | Cost Per Mille | Advertiser | What an advertiser pays for 1,000 impressions |
| eCPM | Effective Cost Per Mille | Both (context-dependent) | Actual revenue per 1,000 impressions, normalized across pricing models |
| RPM | Revenue Per Mille | Publisher | Total revenue per 1,000 impressions, including all ad sources |
The critical distinction: CPM is what advertisers pay. eCPM (from a publisher’s perspective) is what you actually earn.
RPM and eCPM are closely related — in fact, Google has clarified that for publishers, they essentially represent the same thing: your estimated earnings per 1,000 impressions. The subtle difference is that RPM typically accounts for fill rate, while eCPM does not. If you serve 100 ad requests but only 60 impressions fill, your RPM reflects that gap; your eCPM is calculated only on the impressions that actually delivered.
For B2B platforms, this distinction matters when you’re evaluating demand partner performance. A partner with a high eCPM but low fill rate might generate less total revenue than a partner with a moderate eCPM and near-perfect fill.
What Is a Good eCPM? Industry Benchmarks for 2026
There is no universal “good” eCPM. It depends on geography, device, ad format, audience quality, and seasonality. But benchmarks give you a reference point.
Mobile Ad Format Benchmarks (2026 Global)
| Ad Format | Typical eCPM Range (Global) |
|---|---|
| Banner | $1.20 – $2.00 |
| Interstitial | $3.50 – $6.00 |
| Rewarded Video | $10 – $16+ |
| Native | $1.50 – $4.00 |
Sources: MonetizeMore 2026 benchmarks, global mobile data
B2B-Specific eCPM Ranges
B2B advertising commands significantly different rates than general consumer display. The audience is smaller but far more valuable — procurement managers, supply chain directors, and brand owners making high-stakes purchasing decisions.
- B2B programmatic on open exchanges with basic targeting: $3 – $8 eCPM
- B2B audience-targeted programmatic (premium intent data): $18 – $35 eCPM
- ABM (Account-Based Marketing) display campaigns: $6 – $12 eCPM, depending on company size targeting
For a platform like LooperBuy — connecting global brands and wholesalers directly with Chinese manufacturers — your ad inventory sits at the intersection of B2B intent and cross-border trade logistics. That’s premium positioning. If your eCPM is tracking below $3, you’re likely underselling your audience.
Suggested visual placement: A world map heatmap showing eCPM variation by region, highlighting where B2B sourcing traffic concentrates (Southeast Asia, North America, Western Europe).
Common eCPM Mistakes That Cost You Revenue
Even experienced teams fall into these traps. Here are the most damaging ones — and how to avoid them.
Mistake #1: Chasing High eCPM at the Expense of Total Revenue
A high eCPM on a single placement feels good. But if that placement cannibalizes engagement — pushing users away with aggressive interstitials early in the session — your long-term revenue per user drops. Gaming publishers have documented this cycle: pushing high-eCPM rewarded placements too early inflated short-term numbers while erasing gains through increased churn weeks later.
The fix: Track session-level RPM alongside eCPM. If eCPM rises but session RPM falls, your optimization is destroying value.
Mistake #2: Confusing Ad Network Fees with Your Actual Earnings
When you see a “$4.50 eCPM” reported by an ad network, that is not necessarily what lands in your account. Ad network fees typically range from 20% to 30%. The “effective” in eCPM should account for this — but not every reporting dashboard does it consistently.
The fix: Calculate eCPM from net revenue, not gross. Ask your demand partners whether their reported eCPM is pre-fee or post-fee.
Mistake #3: Ignoring the Fill Rate Relationship
eCPM is calculated on delivered impressions. If your fill rate is low, a high eCPM on the impressions that do serve may mask a larger revenue problem.
The fix: Monitor eCPM and fill rate together. A 95% fill rate at $4.00 eCPM generates more total revenue than an 80% fill rate at $5.00 eCPM on the same volume of ad requests.
How to Use eCPM to Optimize Your Ad Revenue: 5 Proven Techniques
Knowing how to calculate eCPM is step one. Using it to drive decisions is where the real value lives.
Technique 1: Geo-Segmented Floor Pricing
Not all geographies deliver the same eCPM. United States and Japan traffic consistently commands premium rates, while emerging markets like Vietnam and Brazil are growing rapidly but from a lower base.
Set floor prices by geo tier. A procurement manager browsing from Germany should see a higher floor than one from a market with lower monetization potential. Dynamic floor pricing — where the floor adjusts based on real-time demand signals — can lift eCPM without sacrificing fill rate.
Technique 2: Format Mix Optimization
Your highest-eCPM format is not always your best revenue driver. Rewarded video can hit $16 eCPM, but if it disrupts the user experience on a sourcing platform where buyers are researching suppliers, the churn cost may outweigh the gain.
Test format combinations systematically. For a B2B sourcing platform, native placements integrated into product listing feeds often deliver the best balance of eCPM and user retention.
Technique 3: Demand Partner Redundancy
Working with a single ad network limits your eCPM ceiling. Introducing multiple demand partners — and enabling real-time bidding competition between them — directly increases the price your inventory commands.
One documented case: a publisher integrated an additional SSP/DSP partner and achieved a 105% quarter-over-quarter eCPM increase and 126% revenue growth in the first full quarter.
Technique 4: Key-Value Segmentation
If you’re not passing contextual signals about your inventory to demand partners, you’re leaving money on the table. Key-value segmentation — tagging impressions with attributes like industry vertical, user intent signals, and content category — allows buyers to bid more precisely. One AdMob case study showed a 20% eCPM improvement from this technique alone.
For a B2B platform, this means tagging impressions with signals like “procurement intent,” “manufacturing category,” and “cross-border trade interest.” Advertisers targeting those attributes will pay more.
Technique 5: Consent-Aware Monetization
With Apple’s ATT and Android’s Privacy Sandbox reshaping ad targeting, unconsented traffic can earn 20% to 40% lower eCPMs. Building a clear value-exchange consent flow — explaining to users how ads support free platform features — can deliver a 15% to 35% eCPM uplift.
For B2B platforms, the consent conversation is different. Your users are professionals evaluating suppliers, not casual consumers. Frame ad personalization as a tool that surfaces relevant logistics partners, competitive pricing intelligence, and industry-specific offers.
The 2026 eCPM Landscape: Supply Scarcity Is Repricing Everything
Something structural is happening in programmatic advertising, and it directly affects how you should think about eCPM in 2026.
Publisher ad supply has contracted significantly. A benchmarking report covering roughly 20 billion impressions across the UK and US showed ad supply down about 40% year on year in mid-2026. In the same window, UK eCPMs rose approximately 30% and US eCPMs about 7%.
What’s driving this? AI-powered search is reducing referral traffic to open web publishers. Less traffic means fewer impressions. Fewer impressions mean the remaining inventory becomes scarcer — and scarcity drives prices up.
What this means for B2B platforms:
- Your inventory is more valuable than it was 12 months ago. If your eCPM hasn’t risen, your floor pricing or demand partner mix may need revisiting.
- Quality signals matter more than volume. Buyers are becoming more selective, concentrating spend on impressions that convert. For a B2B sourcing platform with high-intent traffic, this is favorable positioning.
- Direct deals are gaining ground. As open exchange supply tightens, curated, direct relationships between publishers and advertisers offer better eCPM stability. Consider building direct inventory packages for your most valuable audience segments.
A Practical eCPM Audit Checklist for B2B Publishers
Run this audit quarterly to keep your monetization strategy sharp:
- Calculate blended eCPM across all demand partners using net revenue, not gross.
- Break down eCPM by geo — identify where you’re underpriced relative to benchmarks.
- Compare eCPM by ad format — is your format mix aligned with your audience behavior?
- Check fill rates — high eCPM with low fill is a revenue leak.
- Review demand partner competition — are multiple bidders competing for each impression?
- Verify consent signal coverage — what percentage of your traffic carries targeting permissions?
- Benchmark against industry — use B2B-specific ranges, not general consumer benchmarks.
Suggested visual placement: A downloadable checklist graphic or a before/after dashboard screenshot showing eCPM improvement after implementing these techniques.
Turning eCPM Insight into Sourcing Advantage
Here’s the connection that most B2B platforms miss: your advertising monetization and your core sourcing business are not separate operations. They reinforce each other.
When a global wholesaler discovers Chinese manufacturers through your platform, that engagement journey generates high-intent traffic. That traffic is exactly what brand manufacturers and logistics partners want to reach. By understanding how to calculate eCPM and optimizing it strategically, you’re not just maximizing ad revenue — you’re building a monetization engine that funds better platform features, wider product catalogs, and faster logistics connections.
LooperBuy operates at this exact intersection. As a one-stop B2B sourcing platform connecting global buyers with Chinese manufacturers across every product category, we understand that your platform traffic is a strategic asset. Whether you’re a brand owner looking to reach procurement audiences or a platform operator optimizing your own ad inventory, the same principle applies: high-intent B2B traffic commands premium eCPM when it’s properly packaged and priced.
Ready to turn your sourcing platform’s traffic into a revenue engine? Explore LooperBuy’s B2B monetization solutions → (placeholder for your LooperBuy CTA link)
Frequently Asked Questions
How do I calculate eCPM if I only have monthly revenue data?
Use the same formula: total monthly revenue ÷ total monthly impressions × 1,000. If you have daily data, you can either aggregate it or calculate daily eCPM values and average them. Daily granularity is more useful for spotting trends.
Is eCPM the same as RPM?
For publishers, they represent essentially the same concept — revenue per 1,000 impressions. The technical distinction is that RPM typically accounts for fill rate, while eCPM does not. In practice, many platforms use the terms interchangeably.
What is a realistic eCPM for B2B display advertising?
On open exchanges with basic targeting, B2B display typically runs $3 – $8 eCPM. With premium audience targeting (intent data, firmographic segmentation), it can reach $18 – $35 eCPM.
Why is my eCPM lower than my minimum CPM?
This happens when ads are requested but not fully rendered — for example, pre-fetched rich media that never becomes viewable. Your floor price applies to delivered impressions; eCPM is calculated across all impressions including those that didn’t serve at the floor.
How often should I recalculate eCPM?
At minimum, monthly. For active optimization, weekly. If you’re running real-time bidding or dynamic floor pricing, you should be monitoring eCPM daily and adjusting strategy based on 7-day rolling averages.
This article is part of LooperBuy’s ongoing series on B2B platform monetization and digital advertising strategy. LooperBuy connects global brands, wholesalers, and manufacturers directly with China’s largest network of vetted suppliers — with transparent pricing, consolidated logistics, and no middleman markups.